Process of Understanding Demand, Supply and Equilbrium
Explain Demand, Supply and Equilbrium
- Demand, draw a downward sloping curve. Quantity demanded varies inversely with price. This curve refers to how much (quantity) of a product or service is desired by buyers. The quantity demanded is the amount of a product people are willing to buy at a certain price; the relationship between price and quantity demanded is known as the demand relationship. The Law of Demand states, if all other factors remain equal, the higher the price of a good, the less people will demand that good. In other words, the higher the price, the lower the quantity demanded. The amount of a good that buyers purchase at a higher price is less because as the price of a good goes up, so does the opportunity cost of buying that good. (Opportunity cost is what you forgo to purchase that good.) Please click on the link below and watch the short video.
Link to Video on Demand Curves
- Supply and demand as we know is one of the most fundamental concepts of economics and it is the backbone of a market economy. Supply represents how much the market can offer. Quantity supplied (offered for sale) varies directly with price, (draw an upward sloping supply curve on the board). The quantity supplied refers to the amount of a certain good producers are willing to supply when receiving a certain price. The correlation between price and how much of a good or service is supplied to the market is known as the supply relationship; price and quantity are directly related. Price, therefore, is a reflection of supply and demand. Equilibrium occurs at the intersection of the demand and supply curve. (Draw this point and dotted lines to the Price and Quantity lines and label P1 and Q1 respectively.) Please click on the link below and watch the short video.
Link to Video on Supply curves
Explain Equilibrium Point
- Equilibrium occurs at the intersection of the demand and supply curve. (If you haven't done so already draw this point and dotted lines to the Price and Quantity lines and label P1 and Q1 respectively.) When supply and demand are equal (i.e. when the supply function and demand function intersect) the economy is said to be at equilibrium. At this point, the allocation of goods is at its most efficient because the amount of goods being supplied is exactly the same as the amount of goods being demanded. Thus, everyone (individuals, firms, or countries) is satisfied with the current economic condition. At the given price, suppliers are selling all the goods that they have produced and consumers are getting all the goods that they are demanding.
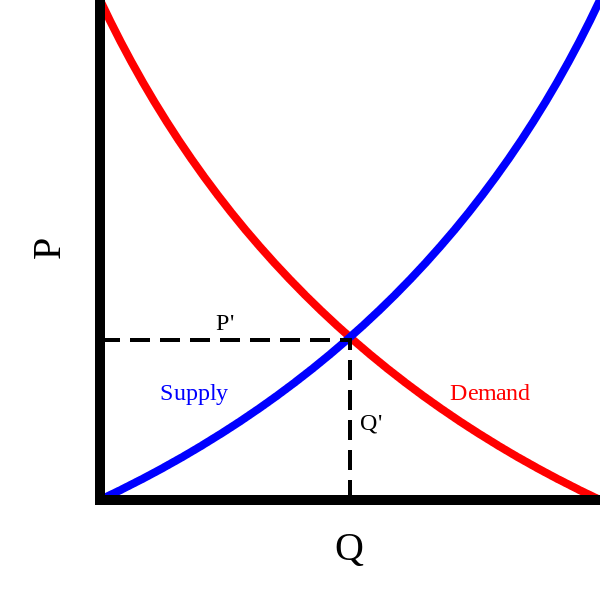
- As you can see on the graph below, equilibrium occurs at the intersection of the demand and supply curve, which indicates no allocated inefficiency. At this point, the price of the goods will be P' and the quantity will be Q'. These figures are referred to as equilibrium price and quantity.
In the real market place equilibrium can only ever be reached in theory, so the prices of goods and services are constantly changing in relation to fluctuations in demand and supply. (At this point your graphs should look like the one below.)